Port of Vancouver, Photo by Ryan McLaughlin
Unadjusted employment in Canada grew by about 220,000 from July to August, or 1.2%, according to Statistics Canada. Employment tends to rise in summer due to sectors like construction and agriculture. After adjusting for this seasonality so that all months in a year are comparable, employment in August was about 5.7% below February levels (or a bit over 1 million workers). This is shown in Figure 1 below.
Figure 1: Canadian Seasonally-Adjusted Employment
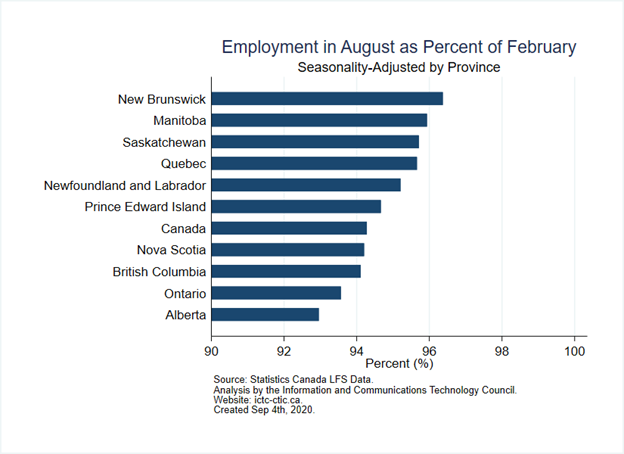
The drop in employment since February varies by province. Figure 2 shows that Alberta remains farthest below February employment levels, still about 7% below the peak, due to drops in the oil and gas sector. Provinces like Ontario and BC, with large service-sector urban employment, are also farther below February levels.
Figure 2: Employment Drop Since February by Province

As documented in Canada’s recently released Revised Labour Market Outlook for 2022, Canada’s “Digital Economy” is much less affected by the crash than other sectors. This is because demand for digital services is heightened during quarantines, and digital economy workers are more able to work from home. Figure 3 shows that seasonally unadjusted employment across sectors has dropped most in accommodation and food services, and oil and gas since February. Meanwhile, August employment in Information and Communication Technology is about 9% above the February value.
Figure 3: Employment Drop Since February by Sector
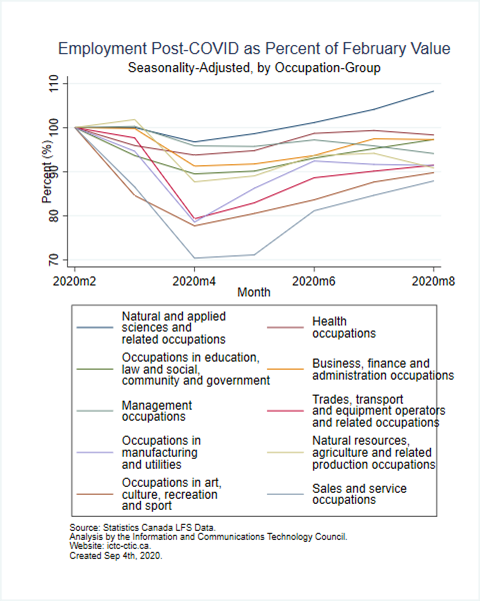
Likewise, scientific and technical occupations have been least affected over this period, as shown in Figure 4. Employment in natural and applied sciences is the only broad occupational category with employment above February levels. Meanwhile, sales and service occupations remain 12% below February levels.
Figure 4: Occupational Employment since February
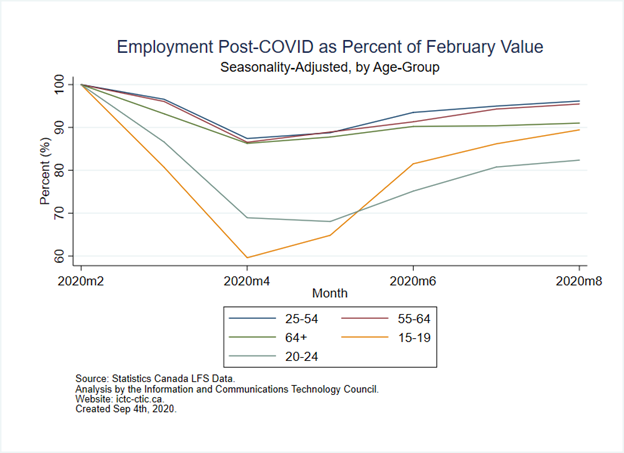
Across age demographics, younger workers remain the furthest from their February employment levels. Figure 5 shows that employment for workers aged 20–24 is still about 18% below February levels. These workers are disproportionately affected in services, and oil and gas.
Figure 5: August Employment as Percent of February by Age
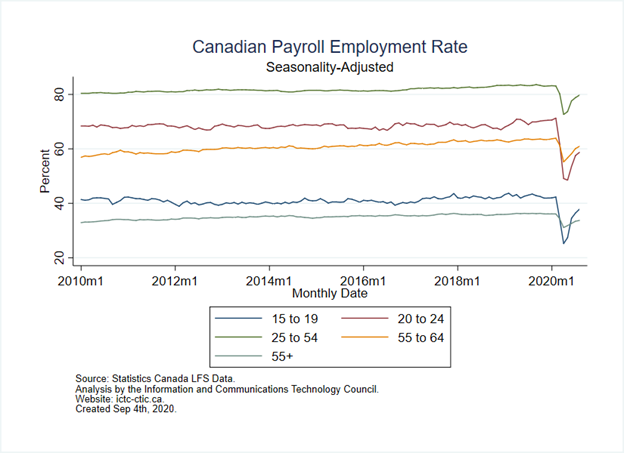
Considering employment as a percent of population by age group, it is clear that while younger workers are most affected, they also have a lower employment rate compared to the peak working age group of 25–54. Roughly 80% of this peak age group was employed in August, down from 83% in February.
Figure 6: Employment Rate by Age Group
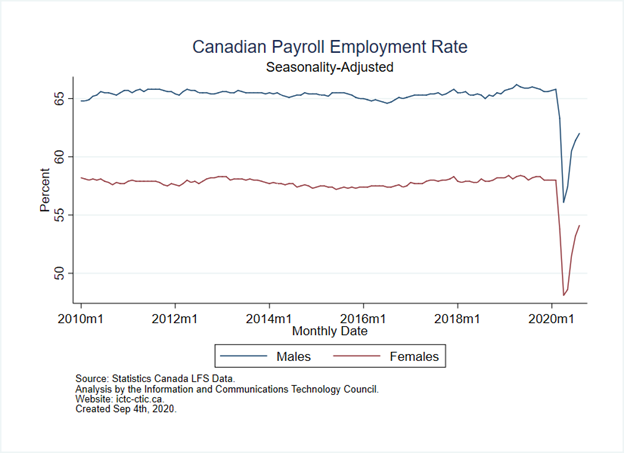
Finally, Figure 7 reveals that the percent of employed males fell from 66% in February to 62% in August. The percent of employed females fell from 58% in February to 54% in August. Therefore, both genders employment rate fell by roughly 4%.
Figure 7: Employment Rate by Gender